- Home
- Products
-
- Cardiovascular System
- Myoglobin (MYO)
- Creatine kinase-MB (CK-MB)
- D-dimer
- Growth Stimulation Expressed Gene 2 (ST2)
- NT-proB-type Natriuretic Peptide (NT-proBNP)
- Lipoprotein-associated phospholipase A2 (Lp-PLA2)
- Heart-Type Fatty Acid Binding Protein (H-FABP)
- Brain natriuretic peptide (BNP)
- Anemia
- Vitamin B12 (VB12)Sandwich
- Inflammation
- Heparin-binding protein (HBP)
- Procalcitonin (PCT)
- C-reactive Protein (CRP)
- Serum amyloid A (SAA)
- Interleukin-6 (IL-6)
- Gastrointestinal Function
- Pepsinogen I (PG I)
- Pepsinogen II (PG II)
- Gastrin-17 (G-17)
- Metabolic Function
- Hemoglobin A1C (HbA1C)
- 25-Hydroxy Vitamin D (25-OH-VD)
- Osteocalcin (BGP)
- Hormone
- Anti-Müllerian Hormone (AMH)
- Follicle-stimulating Hormone (FSH)
- Estradiol (E2)
- Progesterone (PROG)
- Soluble FMS-like tyrosine kinase-1 (sFlt-1)
- Placenta Growth Factor (PlGF)
- Inhibin B
- Oncology
- Carbohydrate antigen 15-3 (CA15-3)
- Carbohydrate antigen 19-9 (CA19-9)
- Carbohydrate antigen 72-4 (CA72-4)
- Carbohydrate antigen 125 (CA125)
- Carbohydrate antigen 242 (CA242)
- Carcinoembryonic antigen (CEA)
- Humanepididymisprotein 4 (HE4)
- Alpha-Fetoprotein (AFP)
- Cytokeratin 19 fragment (CYFRA21-1)
- Neuron-specific enolase (NSE)
- Thyroid Function
- 3,3',5-Triiodo-L-thyronine (T3)
- Thyroxine (T4)
- Thyroid stimulating hormone Receptor (TRAb)
- Thyroid stimulating Hormone (TSH)
- Pneumonia
- Krebs Von den Lungen-6(KL-6)
- Neurological Function
- S100B
- Neurofilament light chain (NFL)
- Kidney
- Retinol Binding Protein 4(RBP4)
- Neutrophil Gelatinase-associated Lipocalin (NGAL)
- β2-microglobulin (β2-MG)
- Kidney Injury Molecule 1 (KIM-1)
- Cystatin C
- Drug of Abuse Screening
- Tetrahydrocannabinol (THC)Sandwich
- Infection
- Monkeypox virus
- Coronavirus Disease 2019 (COVID-19)
- Miscellaneous
- CD8 Antibody
- CD45 Antibody
- CD56 Antibody
- CD45RO Antibody
- Programmed Cell Death Protein 1 (PD-1)
- Programmed Cell Death 1 Ligand 1 (PD-L1)
- Transforming Growth Factor Beta 1 (TGF-β1 )
- Streptavidin
- Taq DNA Polymerase Antibody
- Tumor antigen p53
-
- Ordering
- About Us
- Contact Us
Get a Quote

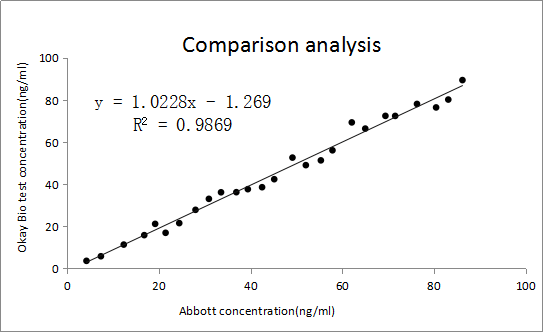 Fig. 1 Clinical sample analysis
 ) ×100% (CV < 15% as indicated in the following table)
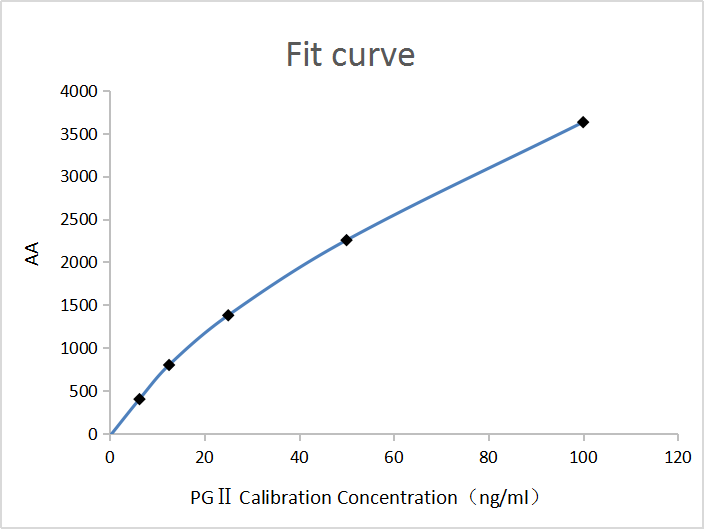 Fig. 2 Calibration curve
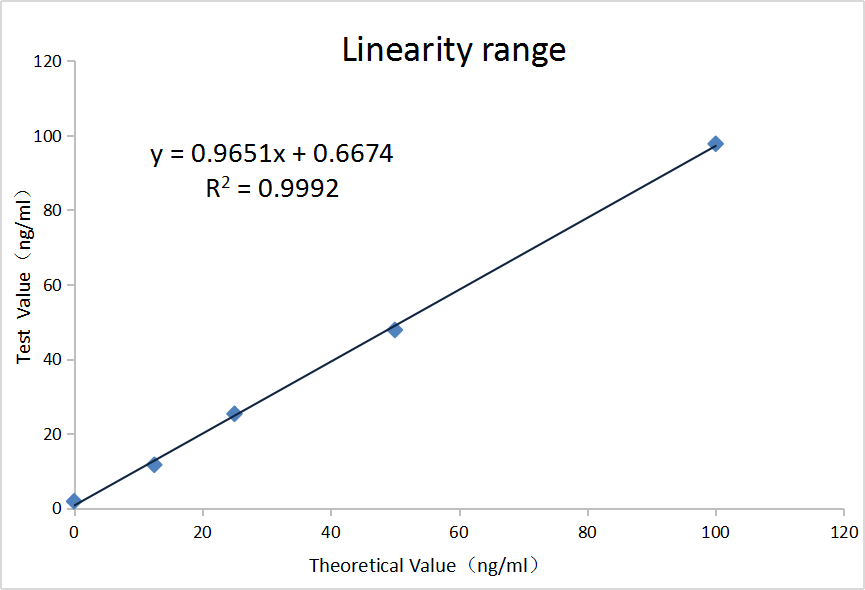
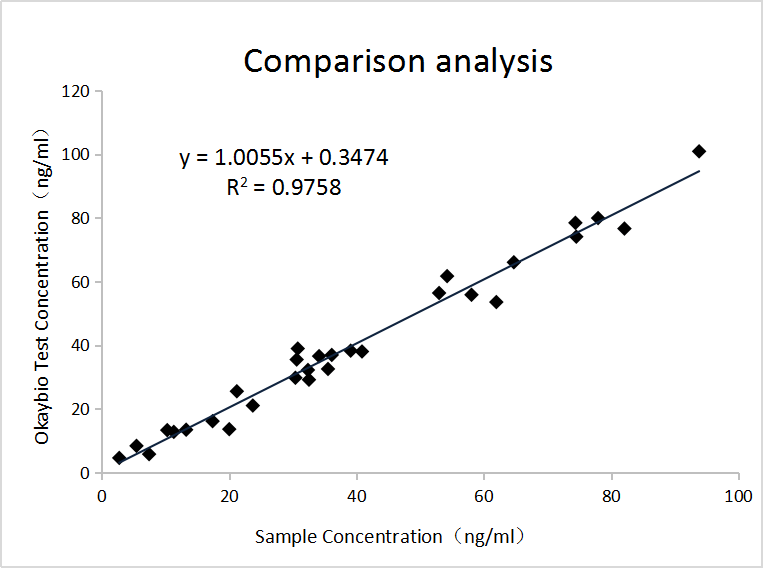 Fig. 4 Calibration curve
 久久久久精品亚洲18国产成人精品无码AV综合_亚洲国产成人精品久久久久av无码综合色_亚洲精品国产无码午夜福利成人毛片中文字幕_亚洲国产婷婷综合在线精品18禁伊人网_亚洲国产综合91精品久久久久久免费黄aa网站_国产黄A级三级无码A成人毛片一区二区三区_91麻豆va国产精品久久久久久精品免费观看_99re国产乱码欧美日本韩高清视频一区二区三区